> ## Documentation Index
> Fetch the complete documentation index at: https://docs.vizcom.com/llms.txt
> Use this file to discover all available pages before exploring further.
# Data
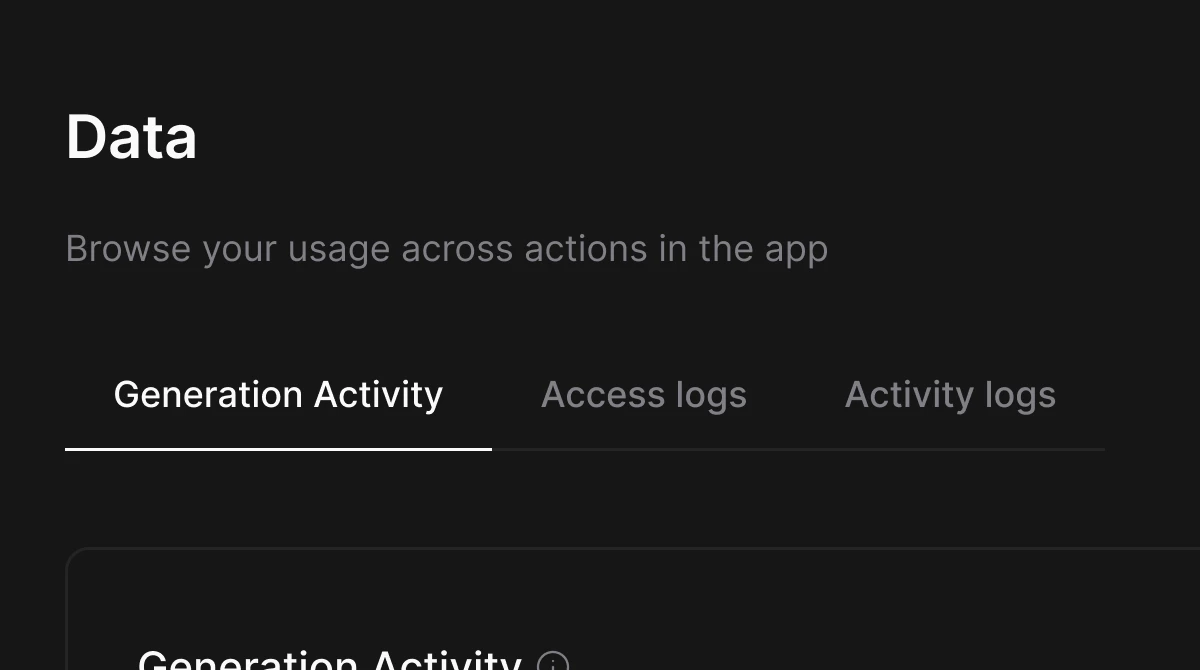
> Enterprise Admins can monitor who accessed Vizcom and when, and review high-level user activity like file creation and edits in the workspace. Monitor how your organization, workspace, or team is using Vizcom with detailed generation, access, and activity data.
## Managing your Vizcom Data
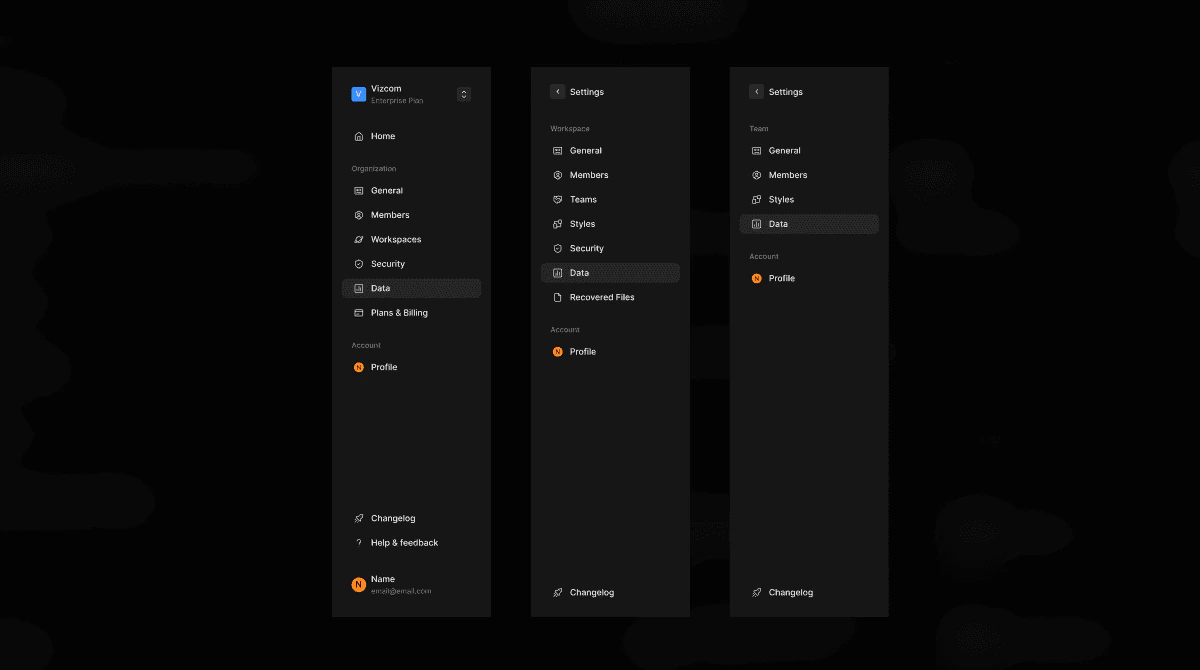
The Data page gives admins a detailed view of usage across their organization, workspace, or team. It is only accessible to admins — Org Admins, Workspace Admins, and Team Admins — and is not visible to Editors or Viewers.
Data is available at three levels: organization-wide, workspace-specific, and team-specific. Navigate to Settings at the relevant level to access the Data page for that scope.
Use Data when you want to understand how members are generating content, track who is accessing the platform and from where, or audit actions taken across files and drawings.
## How to access your Vizcom Data
Accessing Data:
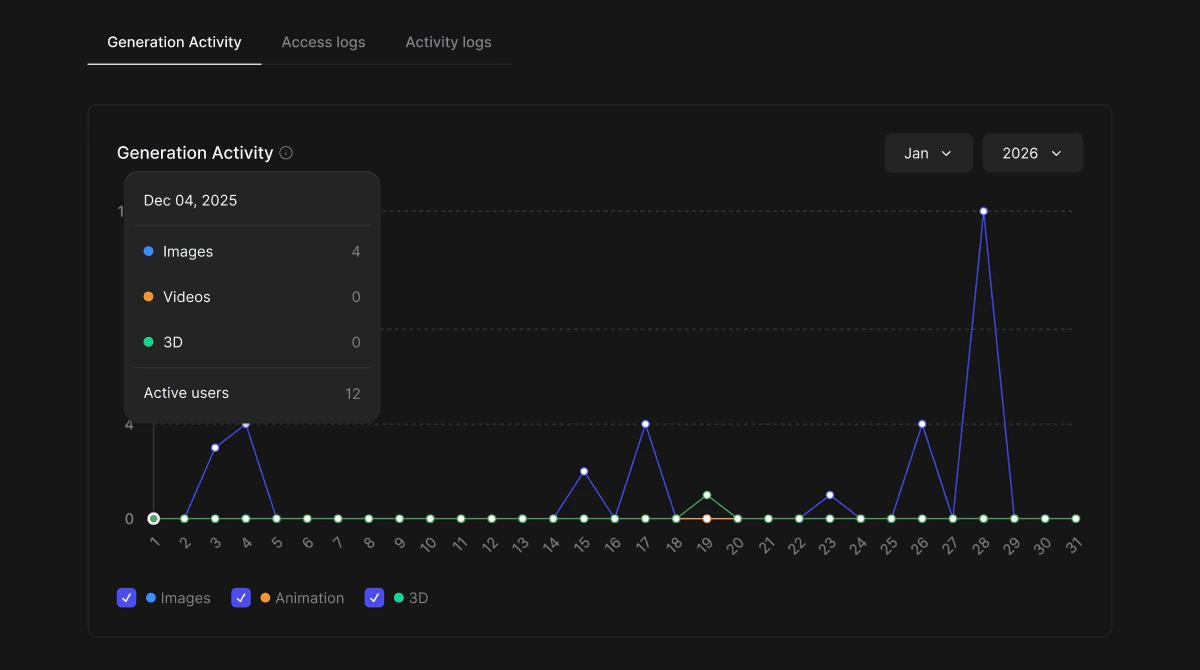
 Reviewing Generation Activity:
 Reviewing Access Logs:
Reviewing Activity Logs:
## Core Features
### Generation Activity
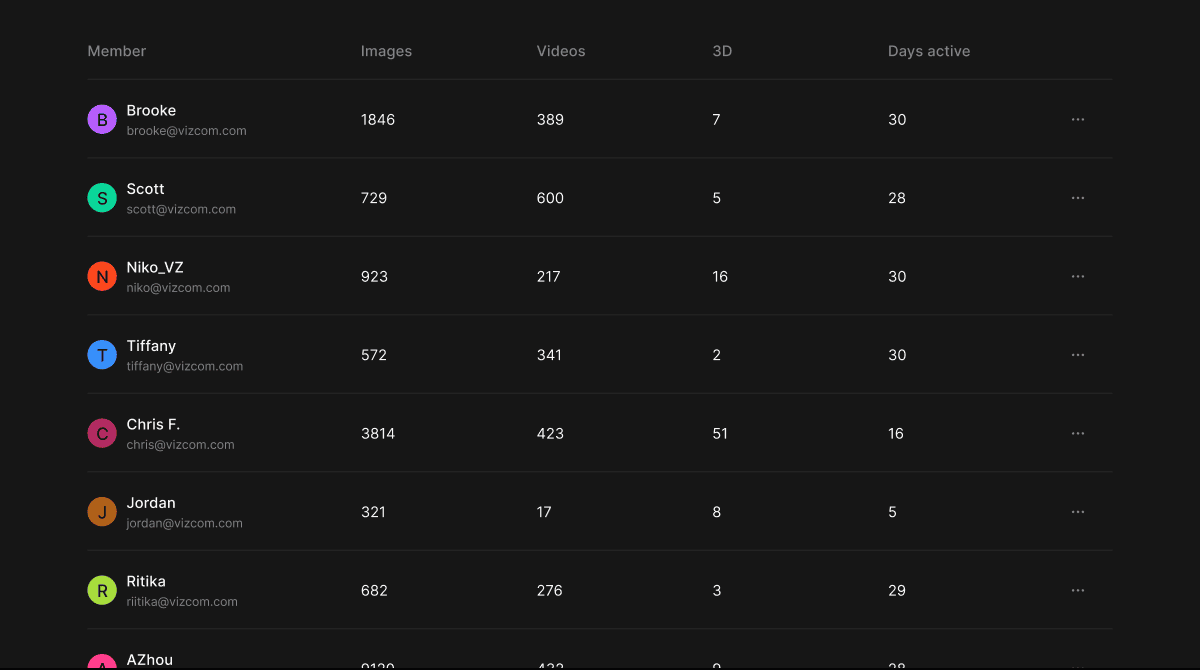
* A time-series chart showing daily AI generation counts across Images, Animation, and 3D for the selected month. Below the chart, a per-member breakdown table shows individual generation counts by type and the number of days each member was active. Use the month and year selectors to review historical data.
### Access Logs
* A paginated log of every instance a member has accessed Vizcom, showing their email, the date and time, IP address, and device and browser. Searchable by email and filterable by time range. Can be exported for external reporting.
### Activity Logs
* A paginated log of actions taken by members across files and drawings, showing the member's email, date and time, action type, and the target file or asset. Searchable by email and filterable by time range and action type. Can be exported for external reporting.
## Tips & FAQ
Use the member breakdown table beneath the Generation Activity chart to quickly identify your most active users or spot members who may not be getting value from the platform.
The Export button on both Access logs and Activity logs lets you download the data as a file — useful for sharing usage reports with leadership or keeping records outside of Vizcom.
### FAQ
* \*\* Who can access the Data page?\*\*
* Data is only accessible to admins. Editors and Viewers do not have access to this page.
* **What is the difference between Access logs and Activity logs?**
* Access logs record when a member logs into or accesses Vizcom, including their IP address and device. Activity logs record actions members take within the platform, such as creating or updating files and drawings.
* **Can I filter logs to a specific member?**
* Yes. Both Access logs and Activity logs include a Search by email field that lets you filter the log to a specific member's activity.
* **How far back does the log data go?**
* Logs can be filtered by time range using the dropdown. The default view shows the last 30 days.
## Next Steps
* Use the Export button to share generation or activity reports with your team or organization.
* Cross-reference Access logs with Activity logs to get a complete picture of a specific member's usage.
* Review Generation Activity monthly to track how AI usage is growing across your workspace or team.
Reviewing Access Logs:
Reviewing Activity Logs:
## Core Features
### Generation Activity
* A time-series chart showing daily AI generation counts across Images, Animation, and 3D for the selected month. Below the chart, a per-member breakdown table shows individual generation counts by type and the number of days each member was active. Use the month and year selectors to review historical data.
### Access Logs
* A paginated log of every instance a member has accessed Vizcom, showing their email, the date and time, IP address, and device and browser. Searchable by email and filterable by time range. Can be exported for external reporting.
### Activity Logs
* A paginated log of actions taken by members across files and drawings, showing the member's email, date and time, action type, and the target file or asset. Searchable by email and filterable by time range and action type. Can be exported for external reporting.
## Tips & FAQ
Use the member breakdown table beneath the Generation Activity chart to quickly identify your most active users or spot members who may not be getting value from the platform.
The Export button on both Access logs and Activity logs lets you download the data as a file — useful for sharing usage reports with leadership or keeping records outside of Vizcom.
### FAQ
* \*\* Who can access the Data page?\*\*
* Data is only accessible to admins. Editors and Viewers do not have access to this page.
* **What is the difference between Access logs and Activity logs?**
* Access logs record when a member logs into or accesses Vizcom, including their IP address and device. Activity logs record actions members take within the platform, such as creating or updating files and drawings.
* **Can I filter logs to a specific member?**
* Yes. Both Access logs and Activity logs include a Search by email field that lets you filter the log to a specific member's activity.
* **How far back does the log data go?**
* Logs can be filtered by time range using the dropdown. The default view shows the last 30 days.
## Next Steps
* Use the Export button to share generation or activity reports with your team or organization.
* Cross-reference Access logs with Activity logs to get a complete picture of a specific member's usage.
* Review Generation Activity monthly to track how AI usage is growing across your workspace or team.